Ever had an app crash right when you needed it? Or ditched a slow-loading website out of frustration? That’s what happens when performance testing is ignored (or implemented weakly). And you can’t treat performance testing as optional, it should be essential for you. In this tutorial, we will walk you through the essentials, from core concepts to advanced methods, so you can build applications or websites that are fast, stable, and ready for real users.
Performance testing is a non-functional testing method that measures how well a system performs under various conditions. While functional testing checks whether software behaves as expected, performance testing focuses on how efficiently it performs.
In simple terms, performance testing verifies how responsive, stable, and scalable your software is under different loads.
For example:
Functional testing asks, “Does this button work?”
Performance testing asks, “How fast does it respond when 1,000 users click it at once?”
Performance testing typically evaluates three key aspects:
Speed – How quickly does the application respond to user actions?
Stability – Can it remain reliable under changing loads?
Scalability – How well can it handle increasing demand?
In a nutshell, performance testing is the process of assessing system responsiveness and stability under specific workloads.
Why is Performance Testing Important?
Performance testing directly impacts your bottom line and user satisfaction. Here’s why it’s absolutely critical:
Business Impact
Poor performance frustrates users and costs real money. Consider these sobering statistics from Testlio:
A 1-second delay in page response can result in a 7% reduction in conversions
This same delay leads to 11% fewer page views and a 16% decrease in customer satisfaction
53% of mobile users abandon sites that take longer than 3 seconds to load
When NVIDIA experienced software quality concerns, their largest customers actually delayed orders for next-generation AI racks, directly affecting revenue projections. The financial consequences of poor performance are very real.
User Experience
Today’s users are less patient than ever. They expect:
Remember, performance testing only works when it’s part of a well-managed, end-to-end process. Focusing on just one type of testing—even performance—can leave critical gaps and lead to costly oversights. That’s where a test management system (TMS) becomes essential. It brings structure, visibility, and alignment across your entire testing suite.
Aqua cloud is a perfect example of such TMS. It centralises your entire testing process—manual, automated, functional, and performance—into a single, AI-powered platform. With native integrations for tools like JMeter, Selenium, and Jenkins, it allows you to orchestrate performance tests alongside other QA activities seamlessly. Features like customisable KPI alerts and detailed reporting ensure you stay ahead of performance issues, while 100% traceability keeps your testing structured and compliant. Generative AI capabilities like requirements, test cases, and test data creation save you up to 98% of time, while one-click bug-recording integration Capture eliminates all the guesswork in reproducing issues.
Move 2x faster in your test management efforts without sacrificing quality
Performance issues often reveal underlying problems that might not be apparent during functional testing:
Memory leaks that cause gradual degradation
Database queries that perform poorly at scale
Resource utilisation inefficiencies
These issues might not show up during basic testing but will emerge under real-world conditions.
Early Problem Detection
Finding performance issues early in development is vastly cheaper than fixing them in production. Fixing issues in production can cost up to 100x more than addressing them during design or development.
Competitive Advantage
In crowded markets, performance can be a key differentiator. Users will choose the faster, more reliable option when given a choice between functionally similar products.
Neglecting performance testing has real consequences. In early 2023, several major banking apps crashed during peak hours, locking users out of their accounts and triggering public backlash. These failures were avoidable and costly.
Types of Performance Testing
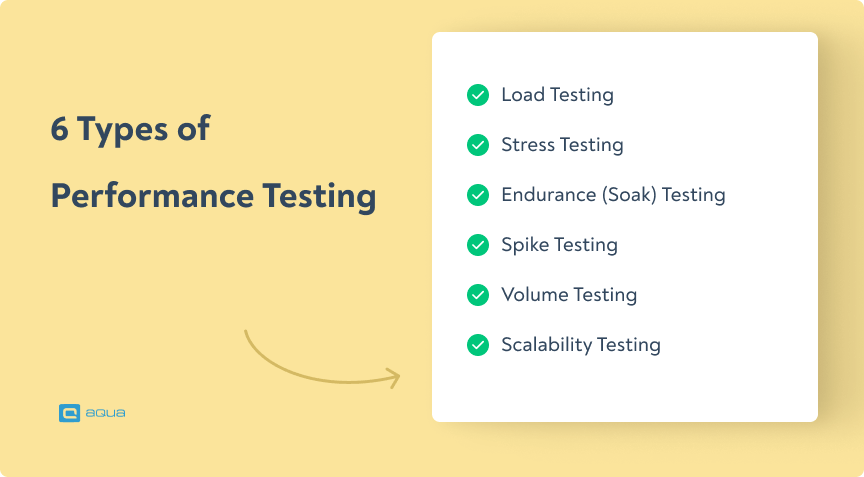
Understanding the different types of performance tests is crucial for effective testing. Performance testing types vary depending on what aspect of your application you need to evaluate. Let’s break down the major types:
1. Load Testing
What it is: Load testing measures how your application performs under expected load conditions. It helps determine if your system meets performance requirements when handling normal or peak user loads.
When to use it:
Before launching new applications or features
To benchmark performance during development
To verify system performance after updates
Example: An e-commerce site testing how its checkout process handles 500 concurrent users during a sales event.
The best way is to check all metrics and search for anomalies. First metrics I check are:
1. 90 and 99 percentiles
2. Latencies
3. Errors or other responses
4. Resources on host (CPU, ram, disk)
What it is: Stress testing pushes your system beyond normal operating conditions to identify breaking points. It helps you understand how your system fails and whether it can recover gracefully.
When to use it:
To prepare for unexpected traffic spikes
To identify performance limits and bottlenecks
To test failover and recovery mechanisms
Example: Testing an application with 200% of the expected maximum user load to see at what point it crashes and how it recovers.
3. Endurance Testing (Soak Testing)
What it is: Endurance testing runs your system under sustained load for an extended period. It helps identify issues that only emerge over time, like memory leaks or resource depletion.
When to use it:
For applications that need to run continuously
To detect gradual performance degradation
To verify system stability over time
Example: Running a banking system continuously for 24 hours with a moderate load to ensure transactions remain speedy and resources aren’t gradually consumed.
4. Spike Testing
What it is: Spike testing evaluates how your system responds to sudden, dramatic increases in load.
When to use it:
For applications that experience unpredictable traffic surges
To verify system behaviour during flash sales or viral events
To test auto-scaling capabilities
Example: A ticket booking platform suddenly receives 10,000 requests when concert tickets go on sale.
5. Volume Testing
What it is: Volume testing assesses how your system performs when processing large amounts of data.
When to use it:
For data-intensive applications
When testing database performance
For systems that handle large files or datasets
Example: A data analytics platform processing and analysing a 500GB dataset to verify that response times remain acceptable.
6. Scalability Testing
What it is: Scalability testing determines how effectively your system can scale up or down to meet changing demands.
When to use it:
When planning for growth
To optimise resource allocation
To test cloud infrastructure elasticity
Example: Gradually increasing users from 100 to 10,000 while monitoring response times and resource usage to identify scaling limitations.
Performance test types vary in purpose and methodology, but understanding these different types of performance tests helps you create a comprehensive performance testing strategy. Choosing the right test types depends on your application’s specific requirements and usage patterns. Most comprehensive strategies incorporate multiple test types to ensure thorough coverage.
Common Performance Problems
Understanding the typical performance issues that plague applications helps you identify and address them before users experience them. A strong performance testing training program would cover these issues in detail. Here are the most common performance problems you’re likely to encounter:
Slow Response Times
What it looks like: Pages take too long to load, actions have noticeable delays, and users get frustrated waiting.
Business impact: Even seemingly minor delays have major consequences, as we mentioned above: a 100-millisecond delay in website load time can reduce conversion rates by 7% or 40% of users abandon a website that takes more than 3 seconds to load
Common causes:
Inefficient code or algorithms
Unoptimised database queries
Too many HTTP requests
Uncompressed resources (images, JavaScript, CSS)
Poor Scalability
What it looks like: The application works well with a few users but degrades significantly as user numbers increase.
Business impact:
Unable to capitalise on growth opportunities
Requires constant infrastructure investment
Lost revenue during high-traffic periods
Common causes:
Architectural limitations
Resource contention
Lack of caching
Synchronous processing bottlenecks
Memory Leaks
What it looks like: The application gradually consumes more memory over time, eventually leading to slowdowns or crashes.
Business impact:
The system requires frequent restarts
Unpredictable failures
Poor user experience for long-running sessions
Common causes:
Objects not properly released from memory
Circular references
Cached data never cleared
Improper resource management
Database Bottlenecks
What it looks like: Database-related operations become increasingly slow as data volume or user concurrency increases.
Business impact:
Transaction times out
Search operations become unbearably slow
Reports take too long to generate
Common causes:
Missing or improper indexes
Inefficient query design
Lack of database caching
Connection pool limitations
Resource Saturation
What it looks like: CPU, memory, disk I/O, or network bandwidth reaches maximum capacity, causing overall system slowdown.
Business impact:
Unexpected infrastructure costs
Inability to handle peak loads
System-wide performance degradation
Common causes:
Inefficient resource usage
Inadequate capacity planning
Resource-intensive background processes
Improper load balancing
Third-Party Service Dependencies
What it looks like: Your application slows down or fails because an external service it depends on is performing poorly.
Business impact:
Issues outside your direct control
Cascade of failures through the system
Loss of critical functionality
Common causes:
API rate limiting
External service outages
Network latency
Improper timeout handling
Each of these problems can significantly impact user experience and business outcomes, but they can all be identified through effective performance testing. If you detect these issues early, you can implement solutions before they affect real users.
How to Perform Performance Testing
Getting started with performance testing might seem overwhelming, but breaking it down into manageable steps makes the process straightforward. If you’re wondering how to do performance testing effectively, follow this comprehensive guide on the performance testing process:
1. Identify Your Testing Environment
Start by thoroughly understanding and documenting your test environment:
Hardware specifications
Network configuration
Database setup
Third-party services and integrations
Software versions and configurations
Your test environment should mirror your production environment as closely as possible to ensure realistic results. If perfect replication isn’t feasible, document the differences and account for them when analysing results.
2. Define Performance Acceptance Criteria
Establish clear performance goals before you start testing:
Response time expectations (e.g., “pages should load in under 2 seconds”)
Throughput requirements (e.g., “system must handle 500 transactions per minute”)
Resource utilisation limits (e.g., “CPU usage should stay below 70%”)
Error rate thresholds (e.g., “error rate must remain under 1%”)
These criteria should be based on business requirements, user expectations, and technical capabilities.
3. Plan & Design Performance Tests
Developing a thorough performance test planning approach is essential. Develop detailed test scenarios that reflect real user behaviour:
Identify key user journeys to test
Determine user load patterns (steady, increasing, or spiking)
Define test data requirements
Select appropriate test types (load, stress, endurance, etc.)
Establish test duration and monitoring approach
Your test plan should document all these details and get stakeholder approval before proceeding.
4. Configure the Test Environment
Prepare your environment for performance testing:
Set up monitoring tools to capture metrics
Configure the necessary test data
Ensure the environment is isolated from external influences
Verify baseline performance before adding load
Install and configure your chosen testing tool
5. Implement Test Design
Create and validate your test scripts:
Script the user journeys identified in your test plan
Include think time between actions to simulate real users
Define appropriate load patterns
Add validation points to verify correct system behaviour
Run small-scale validation tests to ensure scripts work correctly
Most performance testing tools like JMeter allow you to record user actions and convert them into reusable test scripts.
6. Run the Tests
Execute your performance tests according to the plan:
Start with lower loads and gradually increase to target levels
Monitor system performance in real-time
Document any observations or anomalies
Maintain test logs for future reference
Ensure adequate time between test runs if using the same environment
7. Analyse, Tune and Retest
After completing tests, thoroughly analyse the results:
Compare results against acceptance criteria
Identify performance bottlenecks
Analyse resource utilisation patterns
Look for correlations between different metrics
Develop optimisation recommendations
Implement optimisations and retest to verify improvements. This iterative cycle continues until performance meets or exceeds requirements.
Sample Performance Test Plan Structure
Section
Content
Test Objectives
Clear statement of what the testing aims to achieve
System Architecture
Overview of components being tested
Test Environment
Details of hardware, software, and network configuration
Performance Metrics
List of metrics to be collected and analyzed
User Scenarios
Description of user journeys being tested
Load Profiles
Patterns of user load to be applied
Test Schedule
Timeline for test execution
Responsibilities
Team members and their roles in the testing process
Risks and Mitigations
Potential issues and how they’ll be addressed
Learning how to perform tests begins with understanding this structured approach, which ensures comprehensive testing that identifies issues before they impact real users. A well-designed performance test tutorial should always emphasise the importance of this systematic process.
Performance Testing Metrics
Tracking the right performance metrics is crucial for understanding your application’s behaviour under various conditions. Here are the key metrics you should monitor during performance testing:
Response Time Metrics
Average Response Time The average time it takes for your application to respond to a request. These are the benchmarks you need to keep in mind:
Web applications should respond in under 2 seconds
Mobile applications should respond in under 1 second
Peak Response Time The longest response time recorded during testing.
Helps identify worst-case scenarios
Should not exceed 3x the average response time
Server Response Time Time taken for the server to process a request before sending data back.
Helps isolate whether slowdowns are server or client-side
Target: Under 100ms for API responses
Throughput Metrics
Transactions Per Second (TPS) The number of transactions your system can process per second.
Higher is better, but must be balanced with response time
Calculate: Total Transactions ÷ Total Test Time
Requests Per Second The number of HTTP requests your server can handle per second.
Critical for web applications
Helps determine server capacity requirements
Resource Utilisation Metrics
CPU Usage Percentage of processor capacity being used.
Should generally stay below 70-80% under load
Consistent high CPU usage indicates processing bottlenecks
Memory Usage Amount of physical memory being consumed.
Watch for upward trends that don’t plateau (potential memory leaks)
Monitor both heap and non-heap memory for Java applications
Disk I/O Rate of read/write operations to disk.
High disk activity can indicate inefficient caching or database queries
SSDs significantly outperform HDDs for high I/O applications
Network Utilisation Bandwidth consumed by the application.
Helps identify network bottlenecks
Excessive network traffic may indicate unoptimized resources
Reliability Metrics
Error Rate Percentage of requests resulting in errors.
Target: Below 1% under normal load
Calculate: (Error Count ÷ Total Requests) × 100
Concurrent Users Maximum number of simultaneous users the system can support.
Critical for understanding system capacity
Should exceed the maximum expected concurrent users
Database Metrics
Query Response Time How long do database queries take to execute?
Slow queries often cause application bottlenecks
Target: Under 50ms for common queries
Connection Pool Usage Utilisation of database connection pools.
High utilisation may indicate connection leaks or an insufficient pool size
Monitor both active and idle connections
Metric Category
Key Metrics
Optimal Range
Warning Signs
Response Time
Average Response Time
<2s for web apps
Steady increase over time
Peak Response Time
<3x average
Outliers >5x average
Throughput
Transactions Per Second
Depends on requirements
Decreasing under load
Requests Per Second
Depends on requirements
Sudden drops
Resource
CPU Usage
50-70%
Consistent >80%
Memory Usage
Stable plateau
Continuous growth
Disk I/O
<50ms latency
Queue length >2
Reliability
Error Rate
<1%
>5% under load
Concurrent Users
Exceeds expected peak
Response degradation
Tracking these metrics gives you a clear picture of how your app is performing and shows you exactly where it needs improvement.
Performance Testing Test Cases Examples
To run meaningful performance tests, you need test cases that reflect how people actually use your app. Here are some real-world scenarios you can use or adapt.
Test Case 1: Homepage Load Performance
Objective: Verify the homepage loads within an acceptable time under various user loads.
Test Steps:
Navigate to the homepage
Measure page load time
Repeat with 100, 500, and 1000 concurrent users
Metrics to Monitor:
Page load time
Time to First Byte (TTFB)
Time to Interactive (TTI)
Server response time
Error rate
Acceptance Criteria:
Page loads in <2 seconds with 100 users
Page loads in <3 seconds with 500 users
Page loads in <4 seconds with 1000 users
Error rate remains <1%
Test Case 2: User Login Scalability
Objective: Ensure the login system handles peak user authentication requests.
Test Steps:
Execute login requests with valid credentials
Gradually increase from 10 to 1000 concurrent logins over 10 minutes
Maintain peak load for 5 minutes
Measure response times and success rates
Metrics to Monitor:
Authentication response time
Database query performance
CPU and memory usage on authentication servers
Session creation rate
Acceptance Criteria:
Login response time <1.5 seconds at peak load
Success rate >99%
No degradation in performance over the 5-minute peak period
Test Case 3: Shopping Cart Checkout Process
Objective: Verify that the checkout process performs well during sales events.
Test Steps:
Add products to the cart
Proceed to checkout
Complete payment information
Submit order
Simulate 500 concurrent users performing this workflow
Metrics to Monitor:
Transaction response time
Database transaction rate
Payment gateway response time
Order confirmation time
Cart abandonment due to performance issues
Acceptance Criteria:
Complete checkout process in <8 seconds
Payment processing in <3 seconds
Database locking/contention issues <0.1%
Order confirmation success rate >99.5%
Test Case 4: Search Functionality Performance
Objective: Ensure the search function remains responsive under heavy load.
Test Steps:
Execute search queries with varying complexity
Include common, rare, and non-existent search terms
Run with 200 concurrent users performing searches
Metrics to Monitor:
Search response time
Database query execution time
Result rendering time
Result accuracy
Acceptance Criteria:
Simple search results in <1 second
Complex search results in <2 seconds
No degradation in result quality under load
Test Case 5: API Endpoint Performance
Objective: Verify API endpoints meet performance requirements for third-party integrations.
Test Steps:
Make calls to key API endpoints
Increase request rate from 10 to 1000 requests per second
Maintain peak load for 5 minutes
Metrics to Monitor:
Response time
Throughput (requests/second)
Error rates
CPU and memory usage
Acceptance Criteria:
95th percentile response time <200ms
99th percentile response time <500ms
Error rate <0.5%
Consistent throughput at peak load
Test Case 6: Content Upload Performance
Objective: Ensure the system handles multiple simultaneous file uploads efficiently.
Test Steps:
Upload files of various sizes (1MB to 50MB)
Simulate 100 concurrent uploads
Monitor system performance during and after uploads
Metrics to Monitor:
Upload speed
File processing time
Storage I/O performance
Memory usage during file processing
Acceptance Criteria:
10MB file upload completes in <10 seconds
The system maintains responsiveness during uploads
No memory leaks after repeated uploads
These example scenarios are just a starting point. Every performance test should be adapted to your app (or website) and its goals, so they reflect real user behaviour and what matters most to your business.
Performance Testing Tools
Selecting the right performance testing tools is crucial for effective testing. A good performance test framework can significantly enhance your testing capabilities. Here’s an overview of popular tools with their strengths, limitations, and ideal use cases:
Apache JMeter
Overview: A free, open-source load testing tool that’s become an industry standard for performance testing.
Overview: An enterprise-grade performance testing solution with comprehensive capabilities.
Key Features:
Support for over 50 protocols and technologies
Advanced analytics and reporting
Realistic network simulation
Integrated with other Micro Focus testing tools
Extensive correlation capabilities for dynamic values
Best For:
Enterprise applications
Complex testing scenarios
Organisations with diverse technology stacks
Teams requiring detailed analysis capabilities
Limitations:
Expensive licensing model
Resource-intensive installation
Steeper learning curve
Gatling
Overview: A modern load testing tool focusing on developer-friendly approaches.
Key Features:
Code-based approach using Scala
Excellent for API and microservices testing
Highly scalable architecture
Rich and interactive HTML reports
Integrates well with CI/CD pipelines
Best For:
Developer-centric testing approaches
API and microservices testing
Teams familiar with coding
Projects requiring high scalability
Limitations:
Less intuitive for non-technical users
Limited protocol support compared to JMeter
k6 (Grafana k6)
Overview: A developer-centric, open-source load testing tool with a focus on developer experience.
Key Features:
JavaScript-based scripting
Cloud and local execution options
Rich extensibility through JavaScript
Integration with monitoring tools
Built for modern development workflows
Best For:
Developer-led performance testing
JavaScript/frontend developers
Modern web applications and APIs
Teams using DevOps practices
Limitations:
Limited protocol support
Less suitable for GUI-based applications
Current performance automation engineer here. I used Jmeter for years but now use a tool called K6. Jmeter can do what you need but I would agree that it is dated, GUI based (intimidating and manual), hard to version control (xml hell) and resource hungry. In the end thou, it does work and has some good out of the box features.
Overview: A cloud-based, browser-focused performance testing platform.
Key Features:
True browser-based load testing
Scriptless test creation
Detailed analytics with browser-level metrics
Virtual user debugger capabilities
Multi-location testing options
Best For:
Web applications with complex front-ends
Teams without scripting expertise
Quick setup and execution
SaaS applications
Limitations:
Higher cost for large-scale tests
Less flexible than code-based tools
Limited protocol support beyond web
Tool Selection Guidelines
Choosing a performance testing tool is not an easy job. When doing it, consider these factors:
Consideration
Questions to Ask
Application Technology
What protocols does your application use? What technologies does it employ?
Team Skills
Does your team prefer coding or GUI-based approaches? What languages are they comfortable with?
Budget
What’s your budget for testing tools? Do you prefer open-source or commercial solutions?
Scale Requirements
How many virtual users do you need to simulate? From which geographic locations?
Integration Needs
What other tools (CI/CD, monitoring) must it integrate with?
Reporting Requirements
What level of analysis and reporting detail do you need?
No single tool fits every situation. Most teams rely on a mix of tools for different testing needs and development stages. Start with one that fits your current goals, and add more as your needs grow.
While the tools above can help you run performance tests, managing them across teams and test types can get messy. aqua cloud brings everything together in one place—manual, automated, and performance tests—so nothing falls through the cracks. With native integrations, built-in reporting, and 100% traceability, you stay in control of every test run. Plus, AI-generated test cases and real-time analytics cut hours of manual work.
Manage all your testing in one AI-powered platform
Performance matters: Even small delays can significantly impact user satisfaction and business success. A one-second delay can reduce conversions by 7% and customer satisfaction by 16%.
Different testing types serve different purposes: Load, stress, and endurance tests each reveal different things. Use them to understand how your app performs under pressure.
Common performance problems are preventable: Test early for things like slow response times, poor scalability, or resource overload—before they reach your users.
A structured approach works best: A complete approach, from setting up your test environment to reviewing the results, helps you cover all the bases and get useful insights.
The right metrics tell the complete story: Monitoring key metrics across response time, throughput, resource utilisation, and reliability provides a holistic view of performance.
Start by defining your environment and goals. Then plan your tests, write your scripts, run them, and analyse the results. Use tools that fit your tech stack, and make sure your scenarios reflect how real users behave.
Is performance testing easy to learn?
It takes some learning, but it’s very doable. Focus on the basics first—like key metrics and concepts. Then try beginner-friendly tools like JMeter. Start small, build up, and use tutorials and forums to speed things up.
What is the basic concept of performance testing?
It’s all about checking how well your app performs under pressure. You’re testing for speed, stability, and scalability—especially when traffic spikes or resources are stretched.
Can JMeter be used for performance testing?
Yes. JMeter is one of the most widely used tools out there. It’s free, supports many protocols, and is great for simulating load, measuring performance, and generating reports.
Which is the best tool for performance testing?
There’s no one-size-fits-all. JMeter is great if you’re on a budget. LoadRunner works well for big enterprises. Dev teams might go for K6 or Gatling for their scriptable approach. Choose based on your team’s skills and app requirements.
What is an example of a performance test?
Imagine 500 users hitting your checkout page during a flash sale. A performance test would check if the site can handle it, monitoring response times, server load, and any errors during the process.
How to write performance tests?
Focus on real user journeys. Set up scenarios with delays and data variations. Script them in your chosen tool, add checks for errors, and make sure your test simulates actual usage—then monitor everything that matters.
How do I become a well performance testing agent?
Learn the core concepts. Get good with a key tool. Understand how apps and infrastructure work. Know some code, learn to spot bottlenecks, and practice a lot. Certifications and communities can also help you grow faster.
What is a typical performance test?
It’s simulating multiple users doing key actions while watching how your app holds up. You ramp up traffic, hold the load, and track things like response time, throughput, and server usage to see where things break—or hold steady.
Embodying the essence of a QA Coordination Maestro, Paul has excelled in curating and implementing quality strategies tailored to the nuances of each project. His expertise in the market of QA and Test Management solutions has contributed to a vast portfolio of successfully managed TMS…
Nurlan, a QA Coordinator & Quality Standards Officer, takes pride in orchestrating seamless QA operations. His expertise in coordinating QA-focused projects and integrating QA solutions has consistently yielded top-tier client satisfaction. Aside from a full-time QA coordinator, Nurlan's role involves creating compelling content that educates…
Join our community of enthusiastic experts! Get new posts from the aqua blog directly in your inbox. QA trends, community discussion overviews, insightful tips — you’ll love it!
We're committed to your privacy. Aqua uses the information you provide to us to contact you about our relevant content, products, and services. You may unsubscribe from these communications at any time. For more information, check out our Privacy policy.
X
🤖 Exciting new updates to aqua Intelligence are now available! 🎉